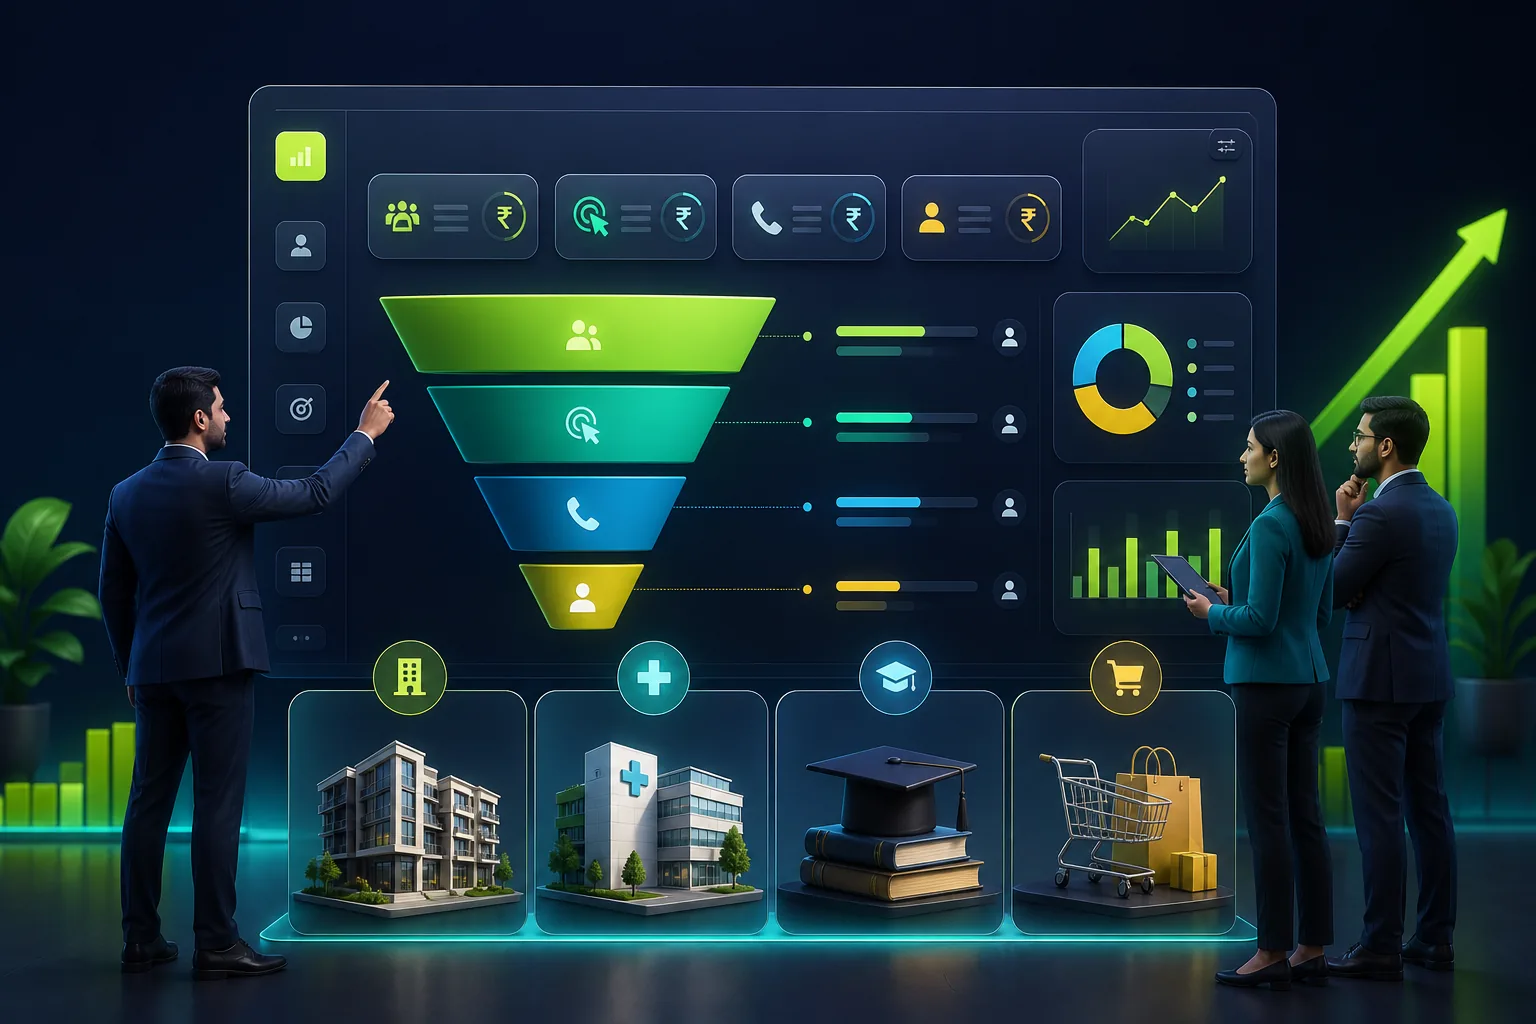
Short answer: No official body publishes an Indian cost-per-lead (CPL) average. Triangulating Indian agency data with US benchmark studies, our 2026 planning ranges for raw CPL are roughly ₹80–₹400 for local services, ₹40–₹800 for education and healthcare, ₹150–₹2,500 for real estate, ₹250–₹3,000 for financial services and ₹800–₹15,000 for B2B and SaaS, depending on channel. US benchmarks run several times higher (LocaliQ's all-industry Google Search CPL is $66.69, about ₹6,450). The CPL you can afford comes from your own deal value and close rate, which we show how to calculate below.
What is a normal cost per lead in India in 2026?
The table gives raw CPL (spend divided by form fills or calls, before any qualification) for campaigns targeting Indian buyers. These are planning ranges for sizing a first test budget, not audited market averages. The next section explains how we built them. Ranges are before GST; Google charges 18% GST on Indian ad purchases.
| Industry (India) | Google Search | Meta lead ads | Main evidence | |
|---|---|---|---|---|
| Real estate (residential) | ₹500–₹2,500 | ₹150–₹1,500 (premium/NRI higher) | Commercial and NRI only | Sell.do Aug 2026 ranges; OwlClaw 2025 client data |
| Education (admissions, study abroad, coaching) | ₹300–₹800 | ₹50–₹400 | Executive education only | OwlClaw; Career Clinic ₹50 CPL |
| Healthcare (clinics, specialty care) | ₹250–₹600 | ₹40–₹350 | Medical devices (B2B) only | OwlClaw; Advancells ~₹40 CPL |
| D2C / ecommerce (lead = enquiry or sign-up) | Judge on CPA/ROAS | ₹180–₹800 for high-consideration products | Not relevant | Codingclave June 2026 ranges |
| B2B services and SaaS | ₹800–₹4,500 | ₹3,000–₹15,000 | ₹2,500–₹10,000 | Codingclave; upGrowth CPC ₹80–₹400 |
| Financial services (loans, insurance, wealth) | ₹400–₹3,000 | ₹250–₹600 | Wealth/HNI only | OwlClaw; upGrowth lending CPC ₹100–₹600+ |
| Local services (home services, repairs, salons) | ₹100–₹400 | ₹80–₹250 | Not relevant | upGrowth ₹150–₹400; OwlClaw |
Two reading notes. First, each range can move two to three times with city, season, offer and form type, so treat the middle of the range as your starting assumption, not the low end. Second, the cheapest channel in the table is rarely the cheapest per customer. A ₹150 Meta lead and a ₹1,500 search lead are different products, which is why the break-even section matters more than the table.
How did we build these India planning ranges?
Indian public CPL data is thin, so we combined four kinds of evidence and kept the ranges wide where they disagree:
- Indian agency-published ranges. OwlClaw's India lead-generation benchmarks give Google, Meta and SEO CPL ranges by industry from its own 2025 client data. upGrowth's Google Ads pricing guide (estimates dated September 2026, from auctions it manages) gives Indian cost-per-click (CPC) ranges by industry and a ₹150–₹400 CPL for local services. Codingclave's 2026 lead-generation playbook (9 June 2026) gives B2B, D2C and LinkedIn ranges from its client projects; its ₹800–₹4,500 B2B search figure is per qualified lead, so raw CPL can be lower. For real estate we added Sell.do's 2026 paid lead-generation ranges (Meta ₹150–₹2,000, Google ₹300–₹2,500, updated 10 August 2026). None of the four discloses sample sizes, so no single one is treated as the answer.
- CPC maths as a cross-check. CPL equals CPC divided by landing-page conversion rate. A B2B search click at upGrowth's ₹80–₹400 converting at 5–10% gives ₹800–₹8,000 per lead, which brackets the Codingclave range.
- US benchmark studies as a ceiling (next section). Indian CPLs should normally sit well below them.
- GrowthSparx first-party results as low-end anchors: ~₹40 average CPL for Advancells (worldwide stem-cell therapy enquiries in a restricted ad category) and ₹50 average CPL with an 8% conversion rate for Career Clinic (study-abroad and medical admissions).
Our anchors sit at the bottom of the healthcare and education ranges. That reflects targeting, offer and follow-up work on those accounts, so it is a reachable floor, not a typical figure.
What do published benchmark studies say, converted to rupees?
The most-cited public datasets come from LocaliQ (the WordStream benchmark series), drawn from thousands of its advertisers' campaigns. Neither page states a geography; LocaliQ is a US company, so read these as mainly US small-business figures and as a ceiling for India. Search figures come from LocaliQ's 2026 search advertising benchmarks (updated 1 June 2026). Meta lead-campaign figures come from LocaliQ's Facebook ads benchmarks (updated 23 September 2026). We converted them at ₹96.72 per US dollar, the 9 October 2026 closing rate reported by Deccan Herald.
| Industry (LocaliQ category) | Search CPL (US$ → ₹) | Search conversion rate | Meta lead-campaign CPL (US$ → ₹) |
|---|---|---|---|
| All industries | $66.69 → ₹6,450 | 8.18% | $27.39 → ₹2,649 |
| Real Estate | $102.51 → ₹9,915 | 3.70% | $13.74 → ₹1,329 |
| Education & Instruction | $77.48 → ₹7,494 | 13.14% | $26.31 → ₹2,545 |
| Physicians & Surgeons | $40.04 → ₹3,873 | 12.43% | $32.14 → ₹3,109 |
| Business Services | $93.69 → ₹9,062 | 4.85% | Not published |
| Industrial & Commercial | $75.19 → ₹7,272 | 8.20% | $35.87 → ₹3,469 |
| Finance & Insurance | $74.44 → ₹7,200 | 2.64% | Not published |
| Home & Home Improvement | $90.92 → ₹8,794 | 8.05% | $42.95 → ₹4,154 |
| Shopping, Collectibles & Gifts | $49.40 → ₹4,778 | 4.01% | Not published |
Three patterns from this data hold in India even though the rupee amounts do not:
- Search leads cost more than Meta leads. The all-industry search CPL is about 2.4 times the Meta figure, largely because the average search click costs $5.42 against $1.80 for a Meta lead-campaign click. Search buys stated intent; Meta buys reach and volume.
- Real estate has the widest gap. Meta lead forms are cheap ($13.74) and search leads expensive ($102.51), with a 3.70% search conversion rate. Indian developers see the same split between social form fills and buyers searching a locality and configuration.
- B2B-type categories sit at the top of search (Business Services, Industrial, Legal), because fewer people search and each deal is worth more.
Why are Indian CPLs usually lower than US benchmarks?
Ad platforms run auctions, so a click costs roughly what competing advertisers can afford to pay for it, which tracks customer value in that market. upGrowth's Indian estimate for SaaS and B2B technology search clicks is ₹80–₹400, against LocaliQ's US Business Services average of $5.87 (₹568). Four forces push Indian CPLs down, and one of them makes cheap leads misleading:
- Lower ticket sizes and margins. A consultation, coaching fee or service contract in India usually earns a fraction of its US equivalent, so bids are lower.
- Large, inexpensive mobile inventory. Tier-2 and tier-3 targeting and regional-language creative can produce Meta form fills for tens of rupees.
- Lower-friction forms. Instant forms pre-filled with a phone number convert at high rates. They also bring more unreachable, duplicate and casual enquiries.
- Different conversion paths. Many Indian buyers prefer to call or start a WhatsApp chat rather than fill a form. If calls and chats are not tracked as leads, reported CPL looks higher than it really is.
The friction point changes the maths most. Example: a ₹60 Meta lead that is unreachable 40% of the time, with 10% of the remainder qualifying, costs ₹60 ÷ (0.6 × 0.1) = ₹1,000 per qualified conversation. Always compare channels on cost per qualified lead, which our guide to tracking qualified leads from Google Ads to CRM shows how to measure.
What does a LinkedIn lead cost in India?
LinkedIn does not publish a CPL average. It does publish its budget rules: a minimum daily budget of US$10 for any ad format (₹967 a day, about ₹29,400 a month), a US$100 minimum lifetime budget for new campaigns, and a suggested starting budget equal to US$25 a day for advertisers billing in other currencies (LinkedIn Marketing Solutions budget guidance, checked October 2026).
Indian published ranges for LinkedIn disagree widely: Codingclave reports ₹3,000–₹15,000 per lead. Our worked estimate shows why. Assume a senior B2B audience in India costs ₹150–₹400 per click (replace this with the suggested bid Campaign Manager shows for your targeting). If 13% of clicks complete a Lead Gen Form (an optimistic assumption for warm audiences), CPL is ₹1,150–₹3,080. Cold audiences convert lower; at 5% the same clicks give ₹3,000–₹8,000. Hence our ₹2,500–₹10,000 planning range. The US$10 daily minimum funds a test of only one audience. Our LinkedIn B2B lead generation guide covers targeting and offers.
How do you calculate the maximum CPL you can afford?
A benchmark tells you what others pay. Break-even tells you what you can pay:
Maximum CPL = allowable acquisition cost per customer × lead-to-customer rate, where allowable acquisition cost = gross profit per customer × the share of it you are willing to spend on marketing.
Every input in these examples is an illustrative assumption. Replace them with your CRM numbers, or plug them into our CPL, CPA and ROAS calculator.
| Business (example) | Allowable cost per customer | Lead-to-customer rate | Maximum CPL | Compared with range |
|---|---|---|---|---|
| Study-abroad counselling, ₹1,50,000 fee, 10% budget | ₹15,000 | 3% (1 in 33) | ₹450 | Inside ₹50–₹400 Meta range |
| B2B SaaS, ₹5,00,000 ACV, 80% margin, spend 50% of gross profit | ₹2,00,000 | 4% (20% to SQL × 20% win) | ₹8,000 | Search and LinkedIn both workable |
| Home-services annual contract, ₹6,000, 40% margin, spend half | ₹1,200 | 25% | ₹300 | Tight against ₹150–₹400 |
| Residential flat, ₹80 lakh, 1.5% marketing budget per booking | ₹1,20,000 | 0.83% (1 in 120) | ₹1,000 | Meta fits; search needs better conversion |
Run the maths in reverse to see what a published result implies. If a campaign delivers ₹50 leads and 8% of leads convert, as in our Career Clinic programme, the media cost per conversion is ₹50 ÷ 0.08 = ₹625. That is the number to compare with fee and margin, not the ₹50.
The home-services row shows why a "good" CPL can still lose money: the business can afford ₹300 per lead only if one in four leads buys. Improving close rate from 25% to 35% raises the ceiling to ₹420, which is usually cheaper to achieve through faster follow-up than through lower bids.
CPL, cost per qualified lead or CPA: which should you manage?
| Metric | Formula | Example (₹50,000 spend) | Use it for |
|---|---|---|---|
| CPL | Spend ÷ leads | 100 leads → ₹500 | Daily campaign optimisation |
| Cost per qualified lead | Spend ÷ sales-accepted leads | 30 accepted → ₹1,667 | Comparing channels and vendors |
| CPA | Spend ÷ customers | 10 customers → ₹5,000 | Whether the business makes money |
| ROAS | Revenue ÷ ad spend | ₹1,50,000 revenue → 3× | Ecommerce and short sales cycles |
Lead-based businesses should manage CPL day to day but set targets on cost per qualified lead and CPA. D2C brands should manage CPA and ROAS. For B2B, the cost model that matters is cost per sales-qualified lead (SQL) and per closed deal, covered in our B2B lead generation cost guide.
How do the NMC advertising guidelines affect healthcare CPL?
On 6 October 2026 the National Medical Commission issued guidelines on ethical advertising and public communication for doctors and medical institutions, effective immediately (Medical Dialogues report of the NMC notice). They prohibit commissions or lead-generation fees tied to procuring patients, and agency or platform arrangements where payment is linked to the referral of individual patients. They also restrict discounts and limited-period offers.
For CPL planning this means a clinic can measure its cost per lead from its own ad spend, but should not buy patient leads from a vendor on a pay-per-lead or pay-per-patient basis, or pay an agency per appointment. Budget healthcare marketing as media plus fixed-fee management, and keep CPL as an internal efficiency metric. Our healthcare digital marketing cost guide covers budgets under these rules.
What should you do when your CPL is far outside the range?
- Far below the range: check contactability and duplicates before celebrating. Pull 50 recent leads and record how many answered, matched your location and had a real need. If fewer than half are reachable, add a qualifying question or switch to a higher-intent form.
- Far above the range: check in this order: search terms or audience (are you paying for students, job-seekers or competitors?), landing-page conversion rate (below 3% on search usually signals an offer or page problem), tracking (are calls and WhatsApp chats counted?), then bids.
- Rising month on month: a higher CPL is acceptable if qualified rate rose with it. Compare cost per qualified lead before cutting budget. Creative fatigue on Meta and new competitors in search are the usual causes.
Once you have three months of data, your own cost per qualified lead by channel replaces every range in this article. Our lead generation team can help you set up the tracking and CRM feedback that baseline needs.
Sources
- LocaliQ: Search Advertising Benchmarks (2026) for search CPC, conversion rate and CPL by industry, updated 1 June 2026.
- LocaliQ: Facebook Advertising Benchmarks for Meta lead-campaign CPL and CPC by industry, updated 23 September 2026.
- OwlClaw: Lead Generation Benchmarks India for Indian Google, Meta and SEO CPL ranges by industry (2025 client data).
- upGrowth: Google Ads Pricing in India 2026 for Indian CPC ranges by industry and local-services CPL, September 2026 estimates.
- Codingclave: Lead Generation India 2026 for Indian B2B, D2C and LinkedIn lead-cost ranges, 9 June 2026.
- LinkedIn Marketing Solutions: budget guidance for minimum daily and lifetime budgets, checked October 2026.
- Sell.do: Paid lead generation for real estate in India 2026 for Indian real estate CPL ranges on Meta and Google, updated 10 August 2026.
- Medical Dialogues: NMC ethical advertising guidelines for the 6 October 2026 NMC rules on lead-generation fees and patient-linked payments.
Currency conversions use ₹96.72 per US dollar, the 9 October 2026 close reported by Deccan Herald. Platform prices and benchmarks were checked on 11 October 2026.